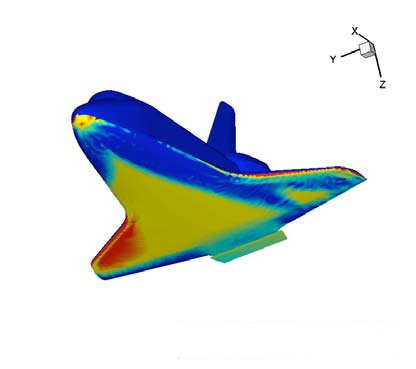
Processing the data can be divided into two major steps – two dimensional image processing for conversion of the raw infrared images into accurate thermal maps, and the mapping of those maps to three-dimensional computer models for direct comparison to Computational Fluid Dynamics (CFD) predictive solutions.
Two-dimensional Image Processing
The goal of the high fidelity image analysis was to produce the best quality global flight temperature map and corresponding uncertainty estimates to which advanced numerical computational predictions could be compared. The analysis has been focused on the sequence of data collected near the point of closest approach to provide the maximum possible spatial resolution.
Image quality is first improved by accurately registering and then averaging selected intensity image frames, thereby improving signal to noise ratio. The registered and averaged frame is then converted to radiance values using sensor calibration data collectively obtained during the flight vehicle observations. Adjustments are applied to account for environmental (i.e., atmospheric) and physical (i.e., surface emissivity etc.) effects. The desired temperature calculation is essentially the reverse of the radiance modeling process used to estimate expected detector performance pre-flight. The Shuttle surface temperature at each pixel location is calculated by iterating the Planck blackbody function over the optical filter waveband.
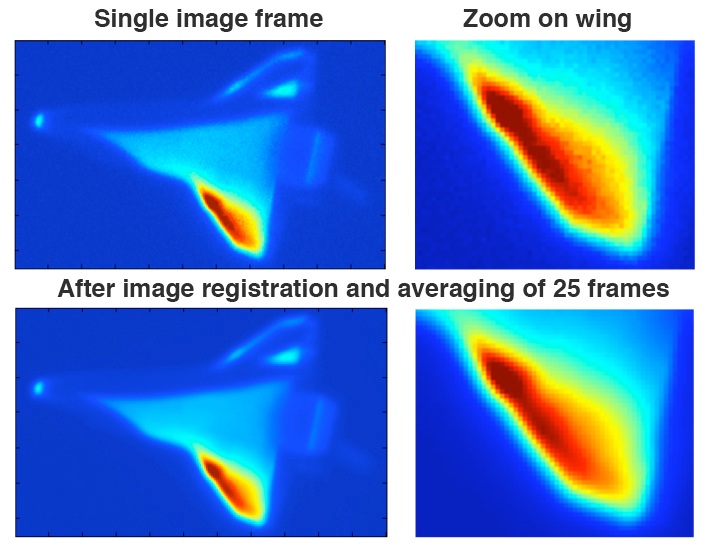
Image blurring was caused by the atmosphere and the optical system, as well as blurring due to jitter and motion. Several steps are implemented to minimize the detrimental effects of blurring and jitter. The process entails the spatial registration of multiple intensity image frames to reduce the detrimental effects from motion (sensor and shuttle), vibration, and atmospherics without compromising the quantitative integrity of the data. Essentially, spatial image registration precisely aligns multiple images so that corresponding image features lie within the same pixel. For the HYTHIRM data, multiple image frames were registered using an automated intensity based method to yield a single image frame at the desired condition. After multiple images were registered to a single image, the individual images were then averaged to improve image signal to noise ratio. For example, the results of averaging 25 intensity frames from the STS-119 imagery near the point of closest approach is shown below. The top two images in this figure show a single intensity image of the Shuttle and the corresponding zoomed section of the wing leading edge near the location of the expected shock-shock interaction. The lower two images show the same intensity image after 25 frames were first registered and then averaged. Visual inspections reveal that the pixel variations were reduced with sharper edge definition using the registration and averaging process.
Calibration data are then applied to the improved intensity images to convert intensity to radiance values. These radiance values are then corrected by removing any contributions from the sky background. Transmission losses of this radiance along the line of sight are then estimated by the MODTRAN atmospheric modeling program. Satellite weather data and appropriate atmospheric models are used to correct the imagery for absorption and sun illumination effects as the lines of sight changed during re-entry (i.e., during STS-125 the early morning sun directly illuminated the bottom surface of Atlantis in contrast to STS-128 where a late afternoon sun directly illuminated only the top and sides of the Orbiter).
Three-dimensional Image Processing

The final step of data processing is the mapping of the two-dimensional thermal imagery onto a three-dimensional representation of the Orbiter. This process is complicated by the need to fit the data imagery, which has spatial distortions due to the perspective of the vehicle with respect to the camera. The John’s Hopkins University Applied Physics Laboratory devised a unique and highly accurate method, based on matching predictive radiometric modeling results with flight data. This iterative technique has produced three-dimensional data mappings for all of the Space Shuttle missions observed by HYTHIRM.
Data Fidelity – Comparison to Computational Fluid Dynamics (CFD)
Can the in-flight measurements really be used for engineering analysis? The answer is a resounding YES. Once mapped to a three-dimensional surface, the data can be directly compared to computational predictions and wind tunnel experimental data, as well as to the data from in-situ thermocouples on the vehicle.
Below is an example of a comparison between HYTHIRM flight data and CFD computations. The upper portion of the Shuttle underside is the solution from a Baldwin-Lomax simulation, while the lower portion is form the STS-119 flight. This data taken at Mach 8.4 represents a mostly turbulent flow, and the computation agrees well in the turbulent portions of the flow. However, the simulation represents a fully turbulent flow, which is why the laminar flow regions near the nose do not match. Also, the simulation did not include the body flap or elevon deflections, which leads to the discrepancies seen on the aft portion of the vehicle. Where conditions match between computation and flight, and where it is known that the CFD solution is valid, we have seen agreement between the CFD and flight imagery measurements that is within approximately 2% of each other.
It is important to note that there are many instances where the state of the art in CFD is unable to provide an accurate representation of the flow conditions. There are also limitations to what can be accomplished in wind tunnels given the high speed / temperature nature of the flowfield. Given that there are only a small number of thermocouples on the underside of the Orbiters (under ten per vehicle) the flight data represents truly unique and invaluable information only obtainable by measurement in flight.


